
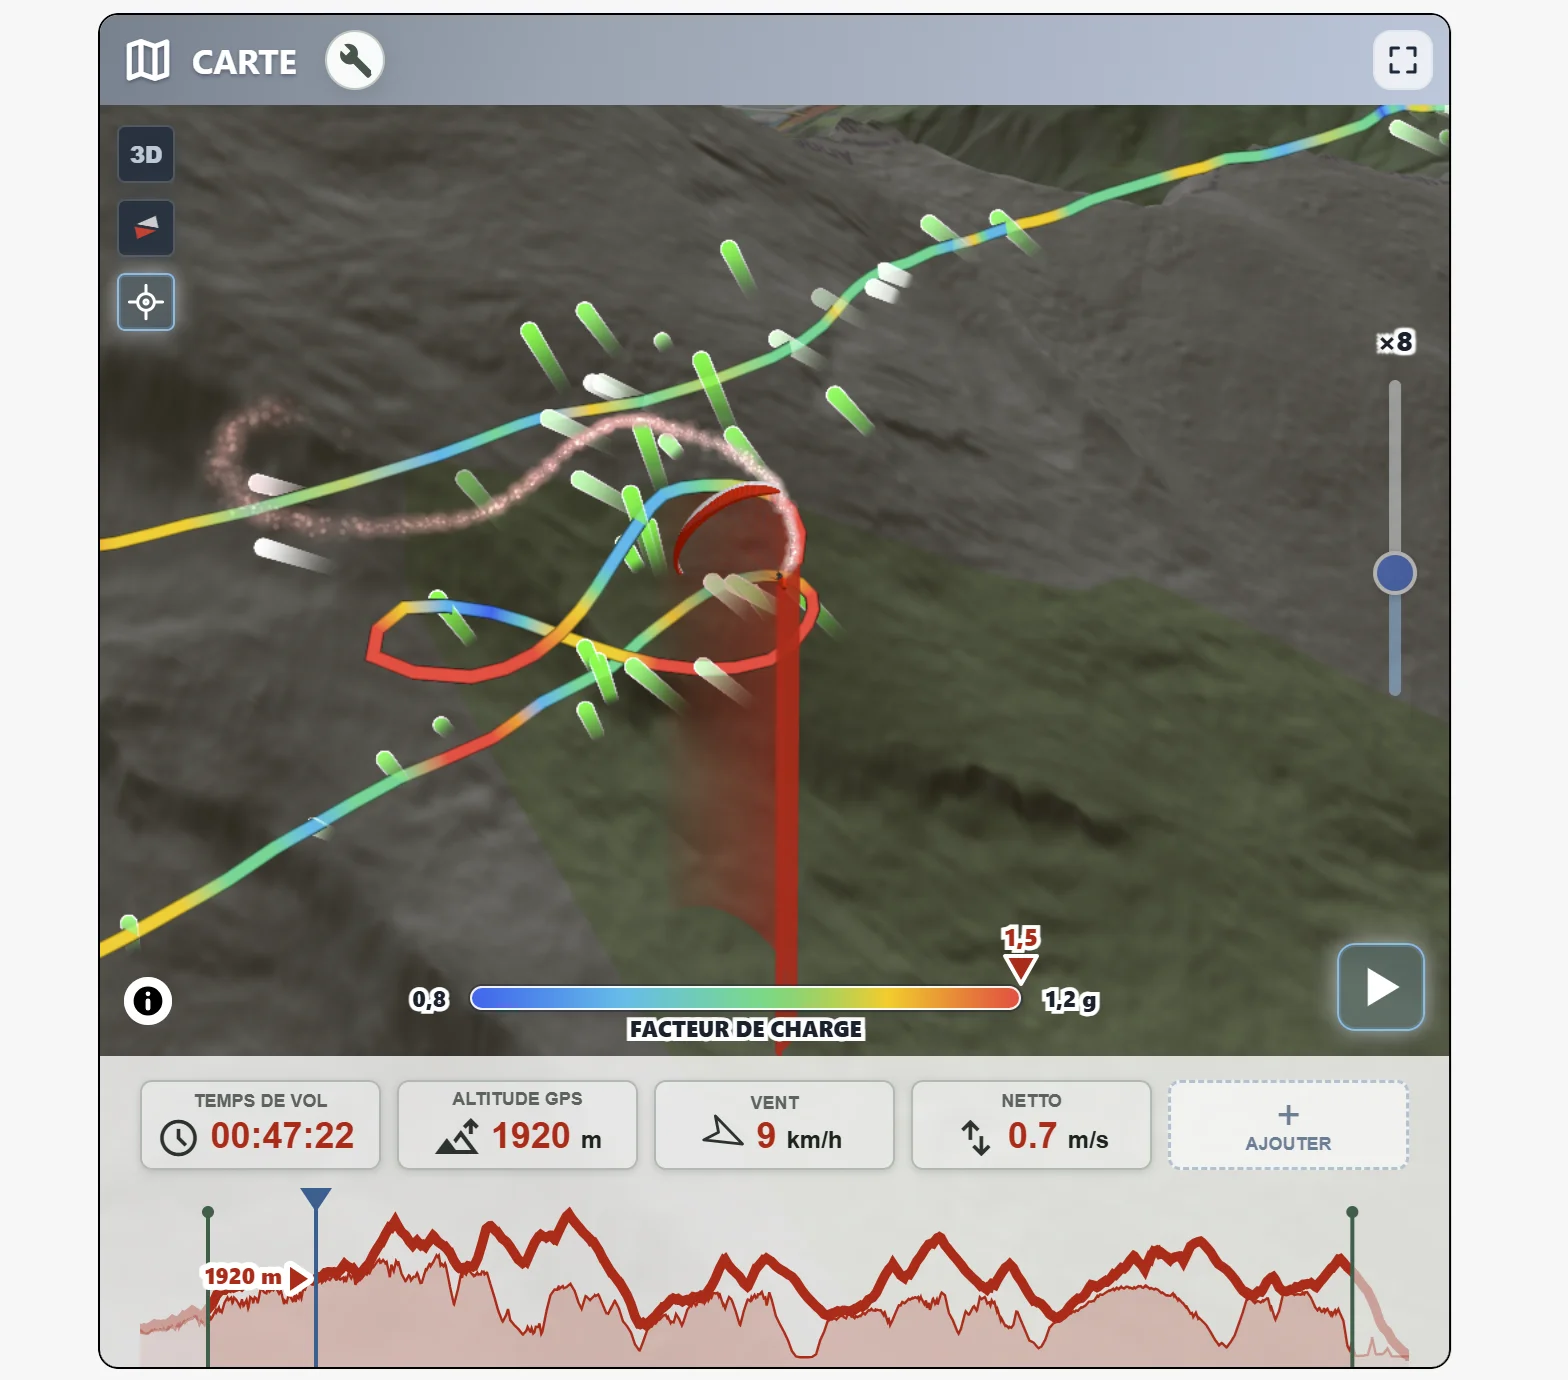
On your smartphone as soon as your wing is down, or on your computer once you are home, open the Viewer in one click to replay your flight in 3D and analyse every detail.
Designed specifically for Vector Vario, the Viewer brings its unique measurements to life in a clear, intuitive interface. The data are easy to read at a glance, and numerous options let you take your analysis much further.
It runs directly in your browser, with nothing to install. Simply import one of your IGC+ files — or choose one of the available demonstrations — and start exploring straight away.
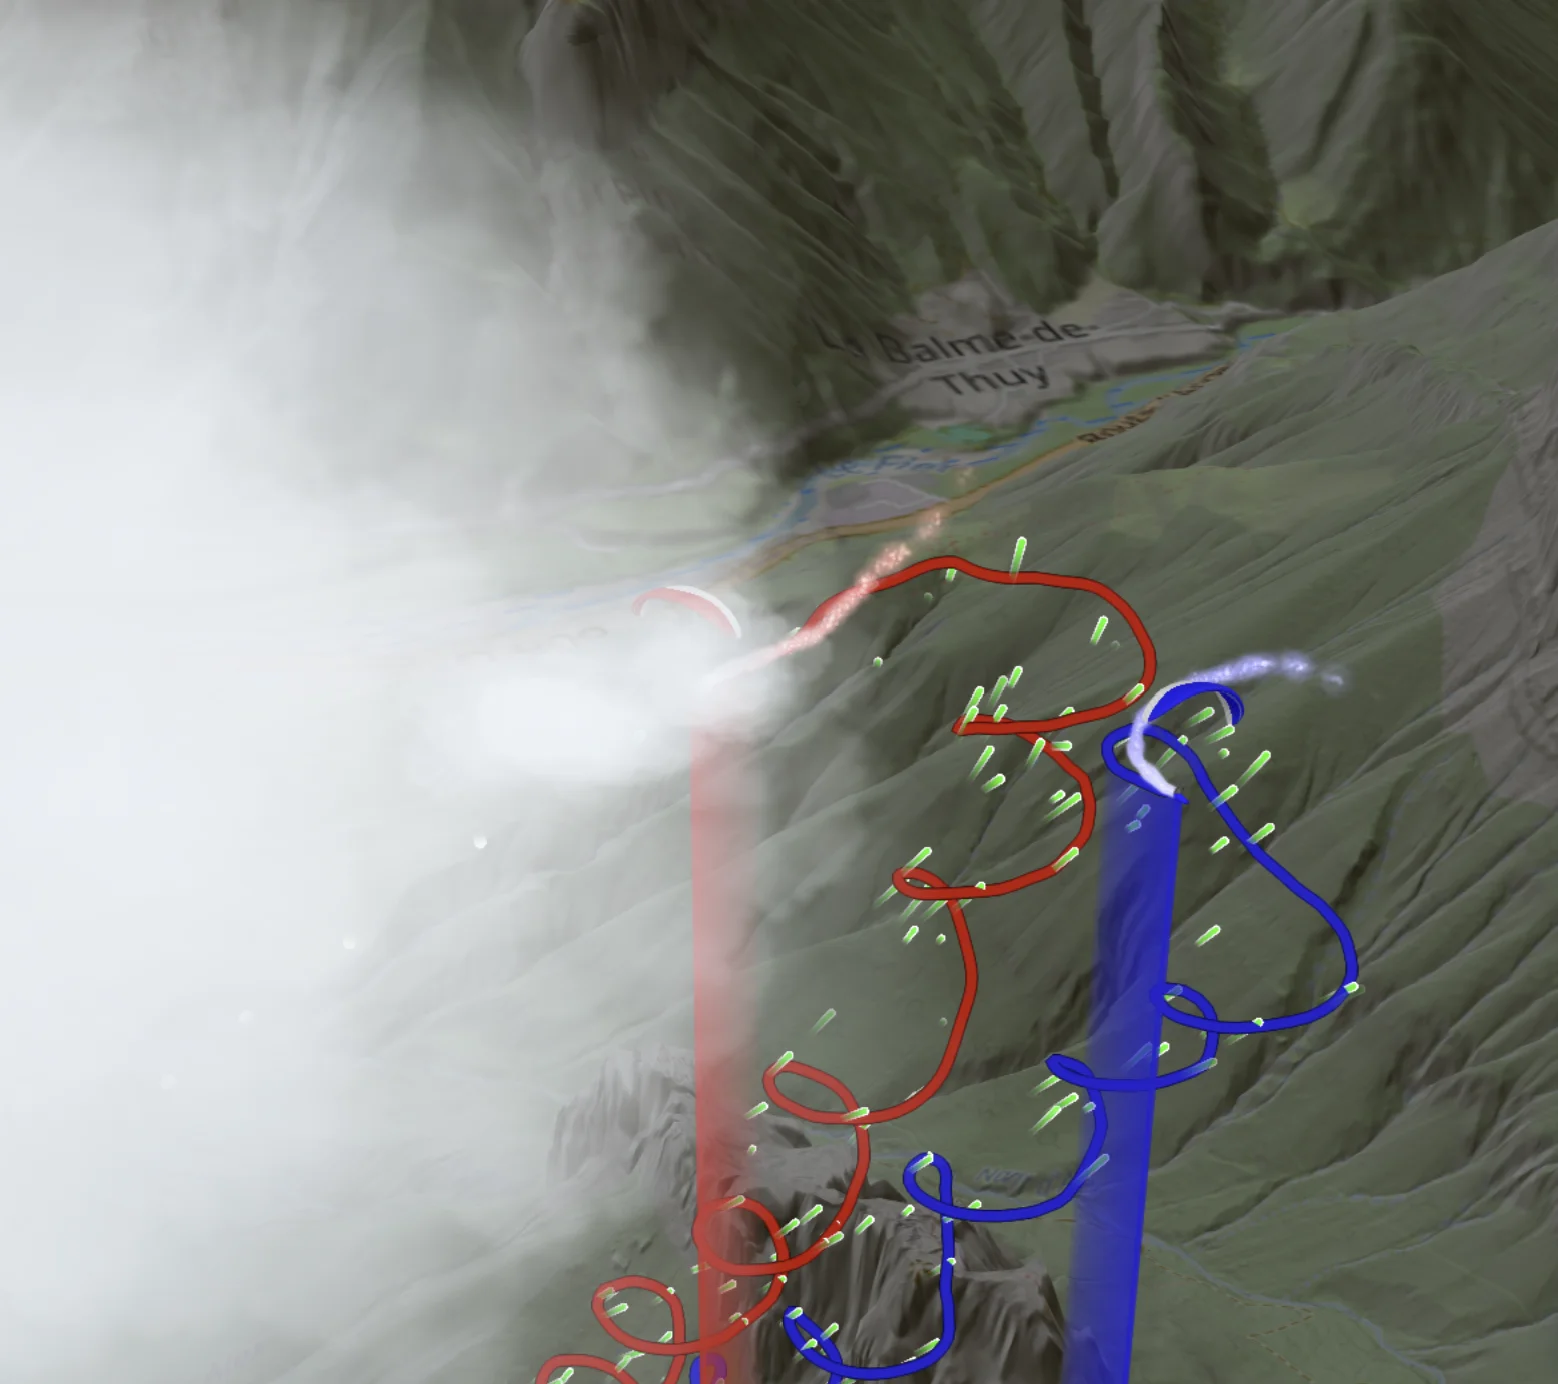
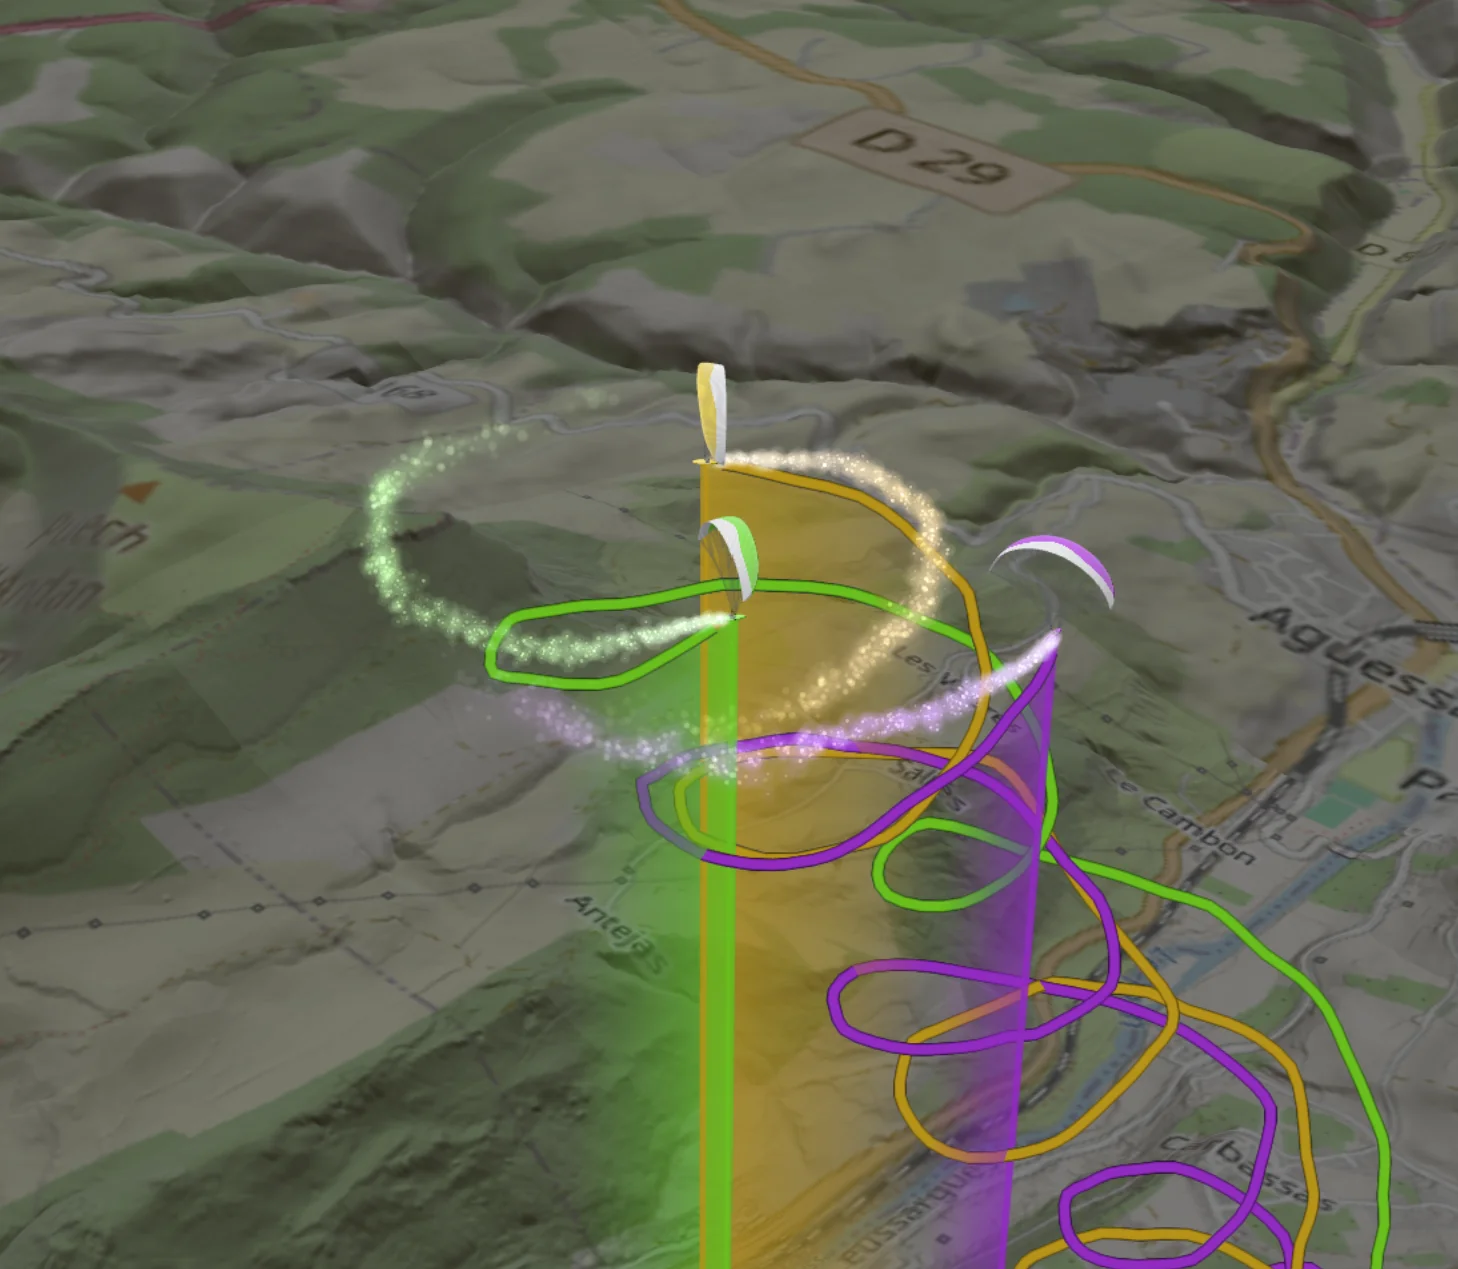
The paraglider is animated in 3D using the pitch, roll and yaw measurements recorded by Vector Vario. You can replay the wing’s movements, whether deliberate or accidental, visualise pitch-ups and surges, or analyse a flight incident. Observe your wing’s actual orientation relative to your track, in thermals and on glides, particularly when the wind comes into play.
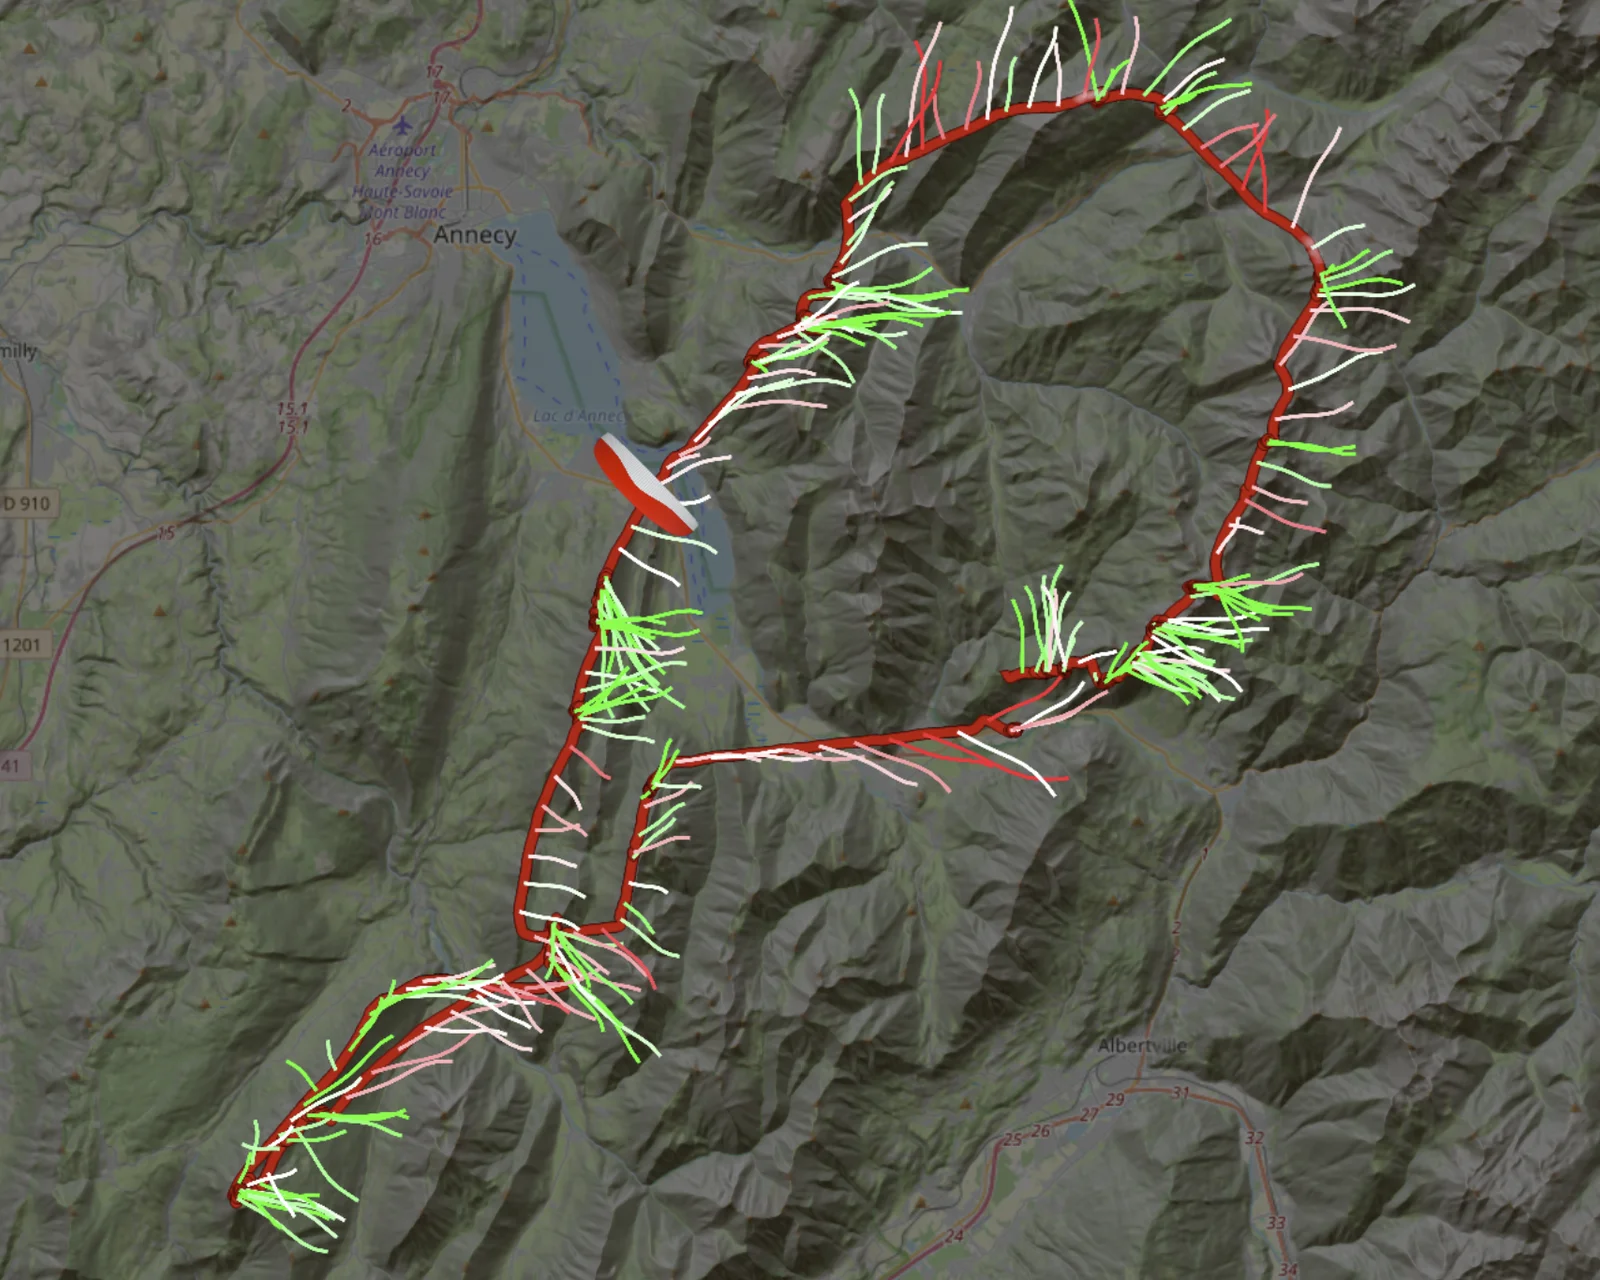
One of Vector Vario’s great strengths is its instantaneous measurement of wind in three dimensions. To make use of these data, the Viewer offers several ways to display them:
- 3D particles overlaid on the track;
- smoke emitted behind the pilot and carried by the wind;
- ribbons attached to the track and animated by the airflow.
Thermalling, soaring and gliding in a crosswind immediately become easier to interpret.
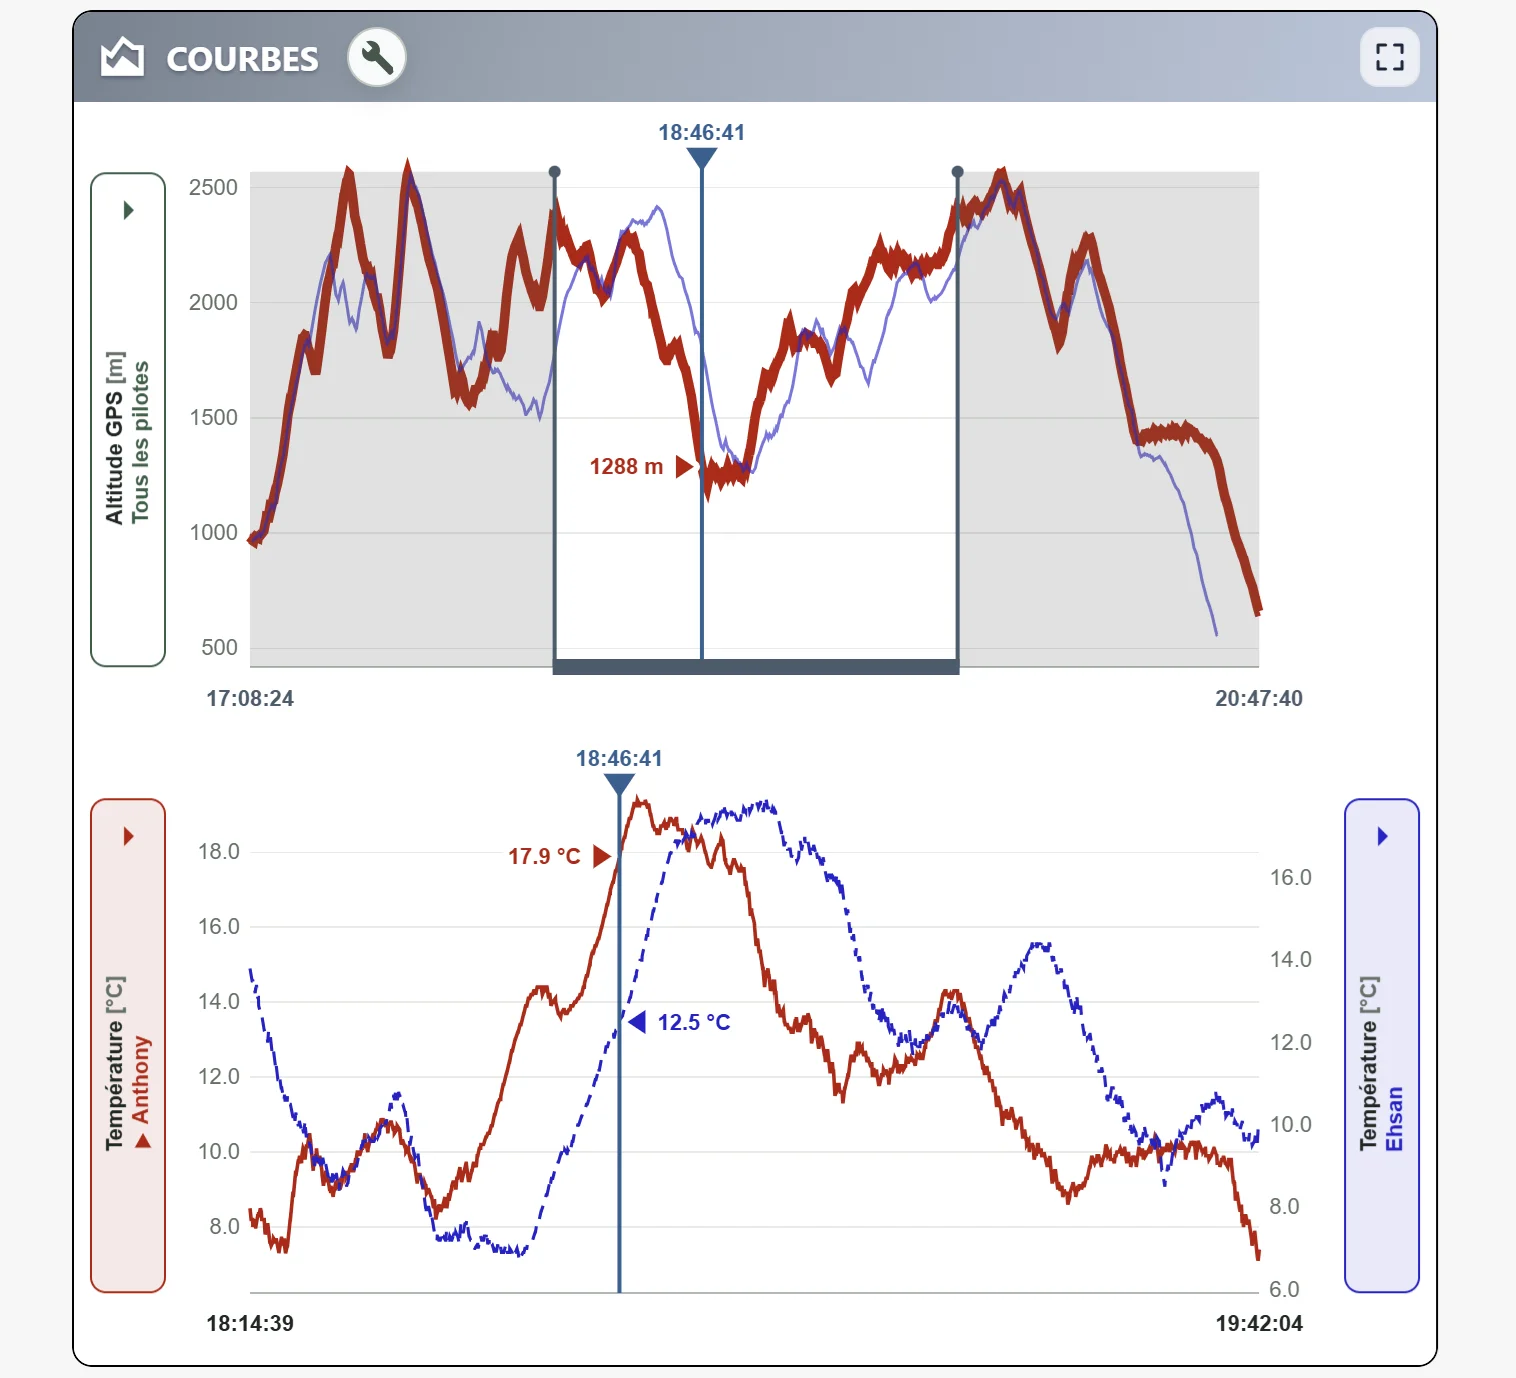
Using Vector Vario’s built-in temperature and humidity measurements, it is even possible to estimate when you pass through a cloud. Naturally, we decided to display those too!
You can enrich the 3D view with all the flight parameters measured by Vector Vario, displayed as values or colours directly on the track. You can also study them separately with graphs and statistics, for one flight or by comparing several flights simultaneously. At this point, you might want a large cup of tea beside your screen: the possibilities for analysis and discussion are almost endless.
And we still have plenty of ideas to make this tool even better…