Wind estimation using GPS only
Wind is usually estimated from GPS position data. The method consists of analysing the drift of the centre of rotation during each turn.
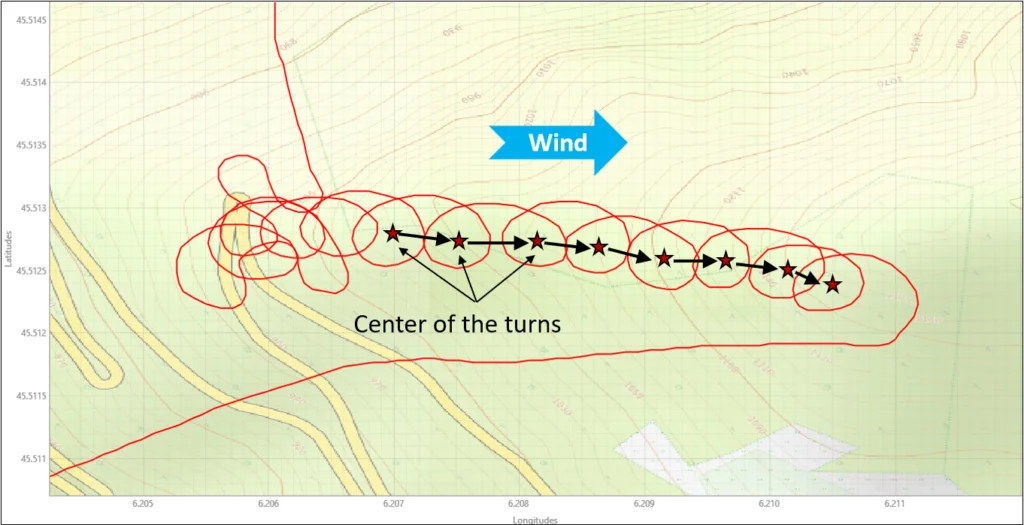
This method has two main limitations:
- Since the estimate can only be updated while turning, it can quickly become outdated. This is especially true in mountainous terrain, where airflow is complex and wind speed and direction can change significantly over just a few tens of metres.
- This estimation method assumes that airspeed and turn rate remain constant throughout the turn, a condition that is not always satisfied.
Wind calculation with the Vector Vario
To calculate the wind, the Vector Vario performs a vector calculation combining GPS data (ground speed and ground track), airspeed measurements, and magnetic heading.
The calculation can be illustrated as follows:
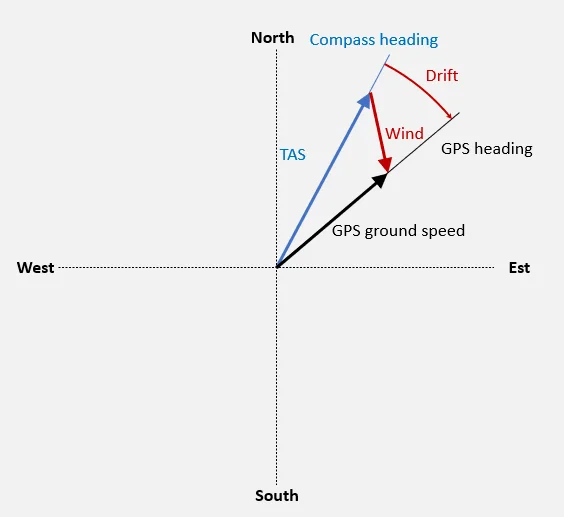
- The black vector (provided by the GPS) corresponds to the trajectory in the Earth reference frame;
- The blue vector combines airspeed (TAS) measurements and magnetic compass heading to provide the trajectory in the air mass reference frame;
- The red vector is the complementary vector required to move from the air mass reference frame to the Earth reference frame: this is the wind vector.
- The angle between the black and blue vectors (that is, between the air mass reference frame and the Earth reference frame) corresponds to the drift angle.
The advantage of this method is that it relies on no simplifying assumptions and allows the wind direction and strength to be estimated during all phases of flight, not only while turning.
The accuracy of this calculation depends on the wind strength and its orientation relative to the flight path, as well as on the accuracy of the airspeed and compass measurements.
In general, it can be noted that during all phases of flight, the stronger the wind, the more accurate the estimation becomes, with even greater accuracy while turning.
Calculating a 3D wind
To calculate wind in three dimensions, the vertical component of the wind is still missing. This vertical component corresponds to the Netto vario.
You can read this article dedicated to the Netto variometer to learn how it is calculated.
Wind visualisation with the Vector Vario
Thanks to its vector-based calculation, the Vector Vario provides a wind estimate continuously throughout the flight and during all phases of flight. This makes it possible to characterise the airflow at a spatial and temporal scale relevant to paragliding.
This is valuable information during flight, but it is also essential for post-flight analysis. That is why wind data (speed and direction) are also recorded with the flight track in the IGC+.
Several options are available for visualising the recorded wind data.
Vector Vario Viewer
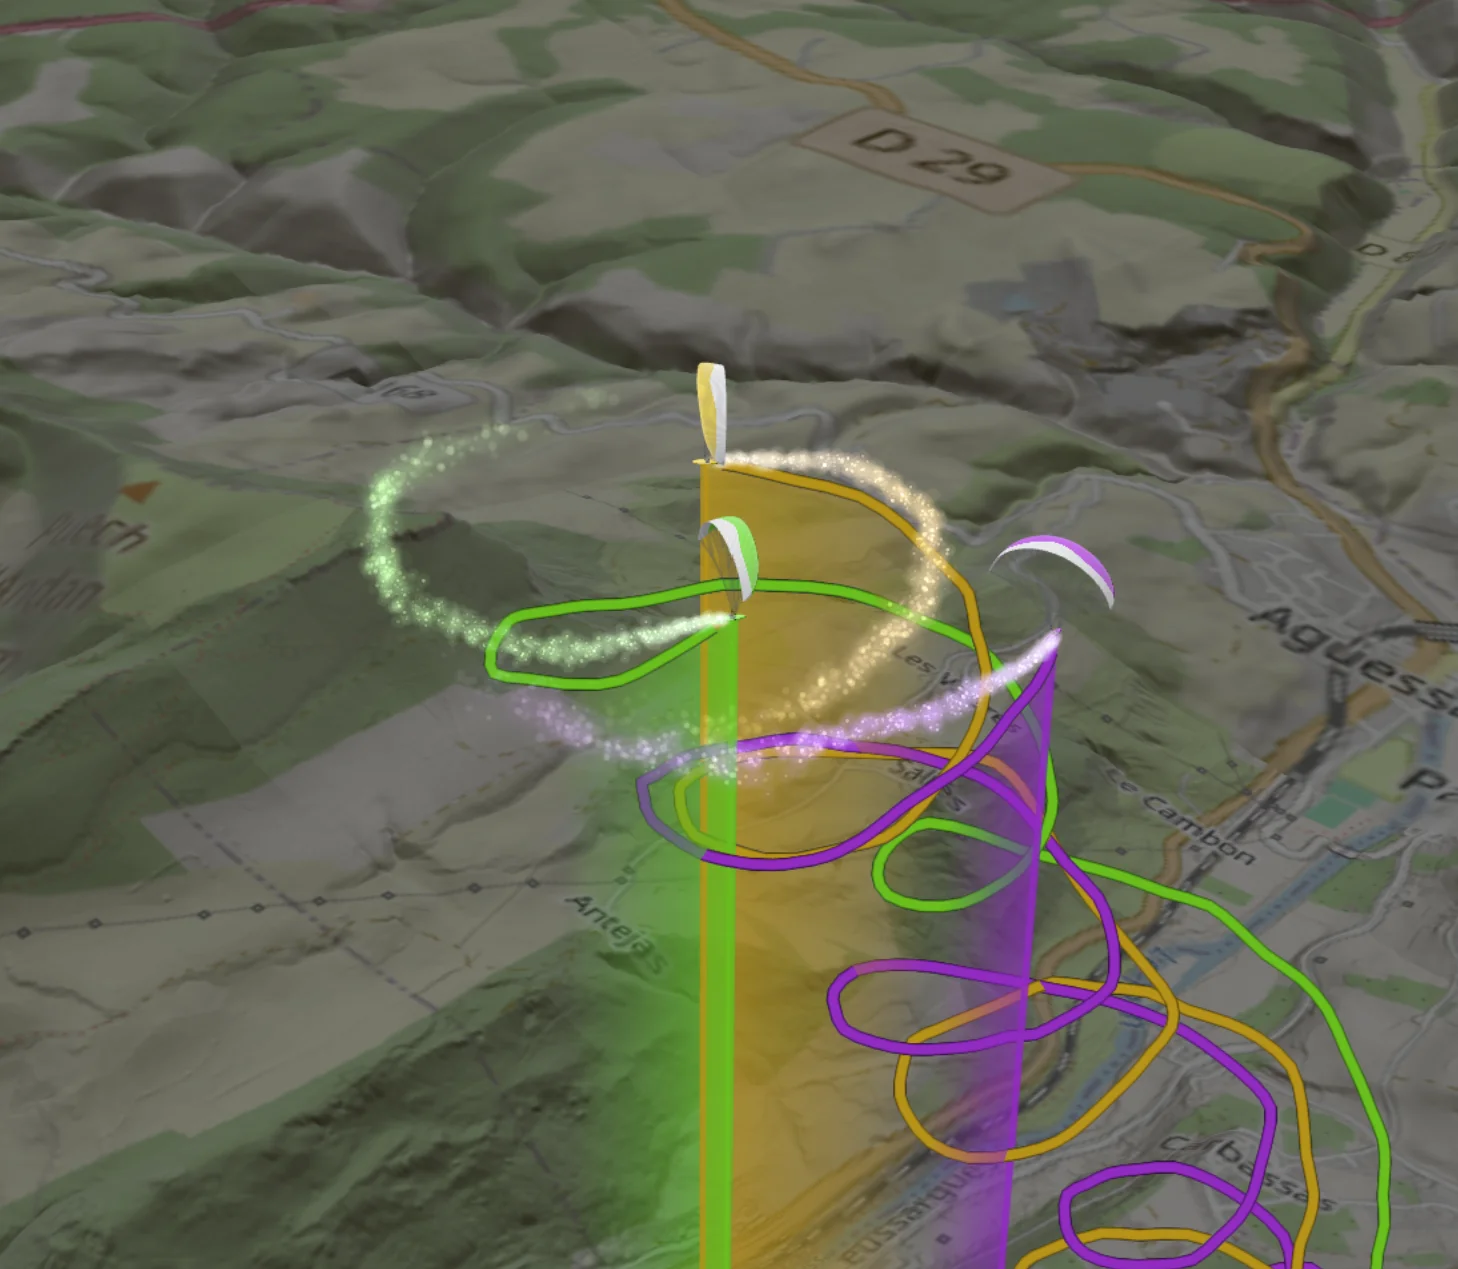
The Vector Vario Viewer lets you replay a flight in 3D and visualise the data recorded by the Vector Vario, directly in a browser with no installation required.
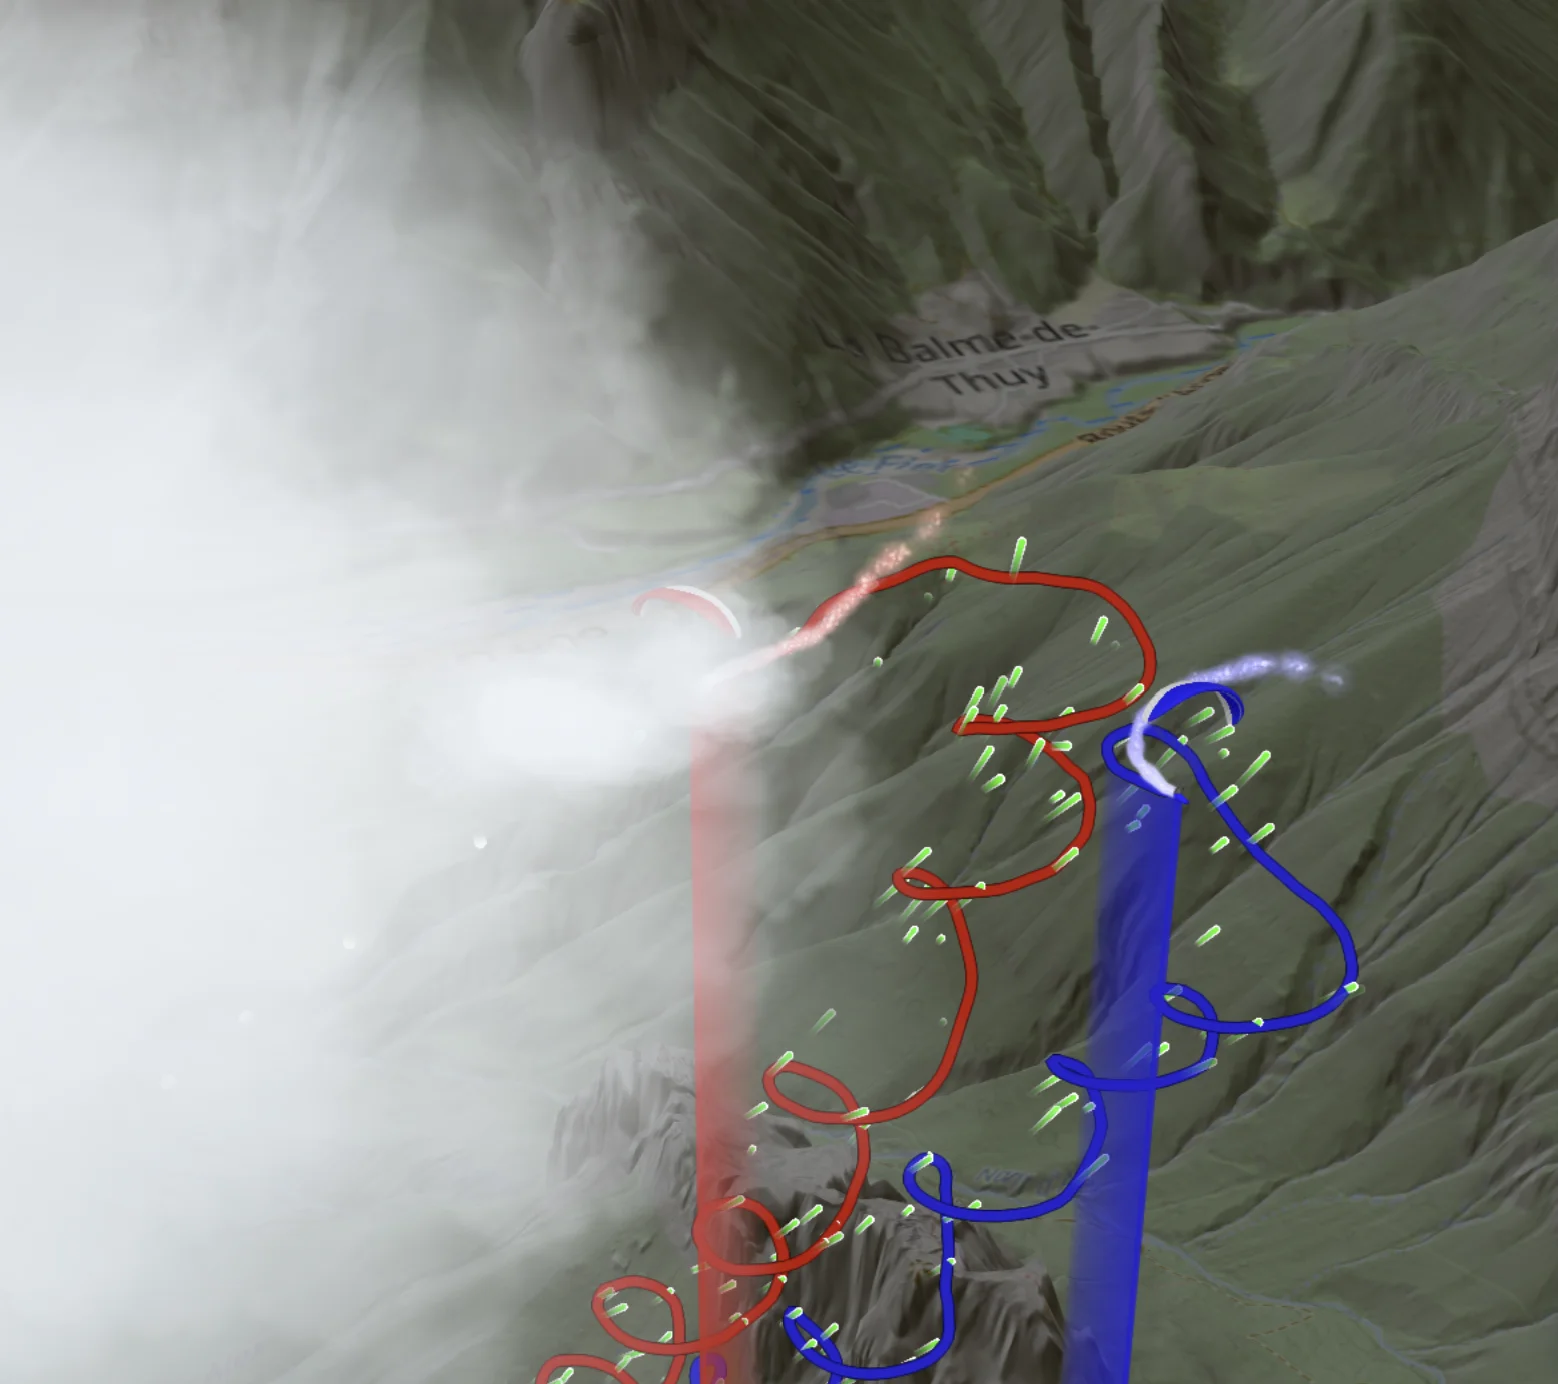
Wind is represented by particles, smoke carried behind the pilot or animated ribbons along the flight track. Displaying clouds adds context to the scene and helps place the flight in its surroundings. The paraglider is animated using pitch, roll and yaw measurements, allowing you to observe the wing’s movements and its orientation relative to the flight path.
Flight parameters can be displayed on the track or analysed using charts and statistics, for a single flight or by comparing several flights simultaneously.
Vector Vario Analyzer
The Vector Vario Analyzer is the software used to visualise all the information recorded by the Vector Vario.
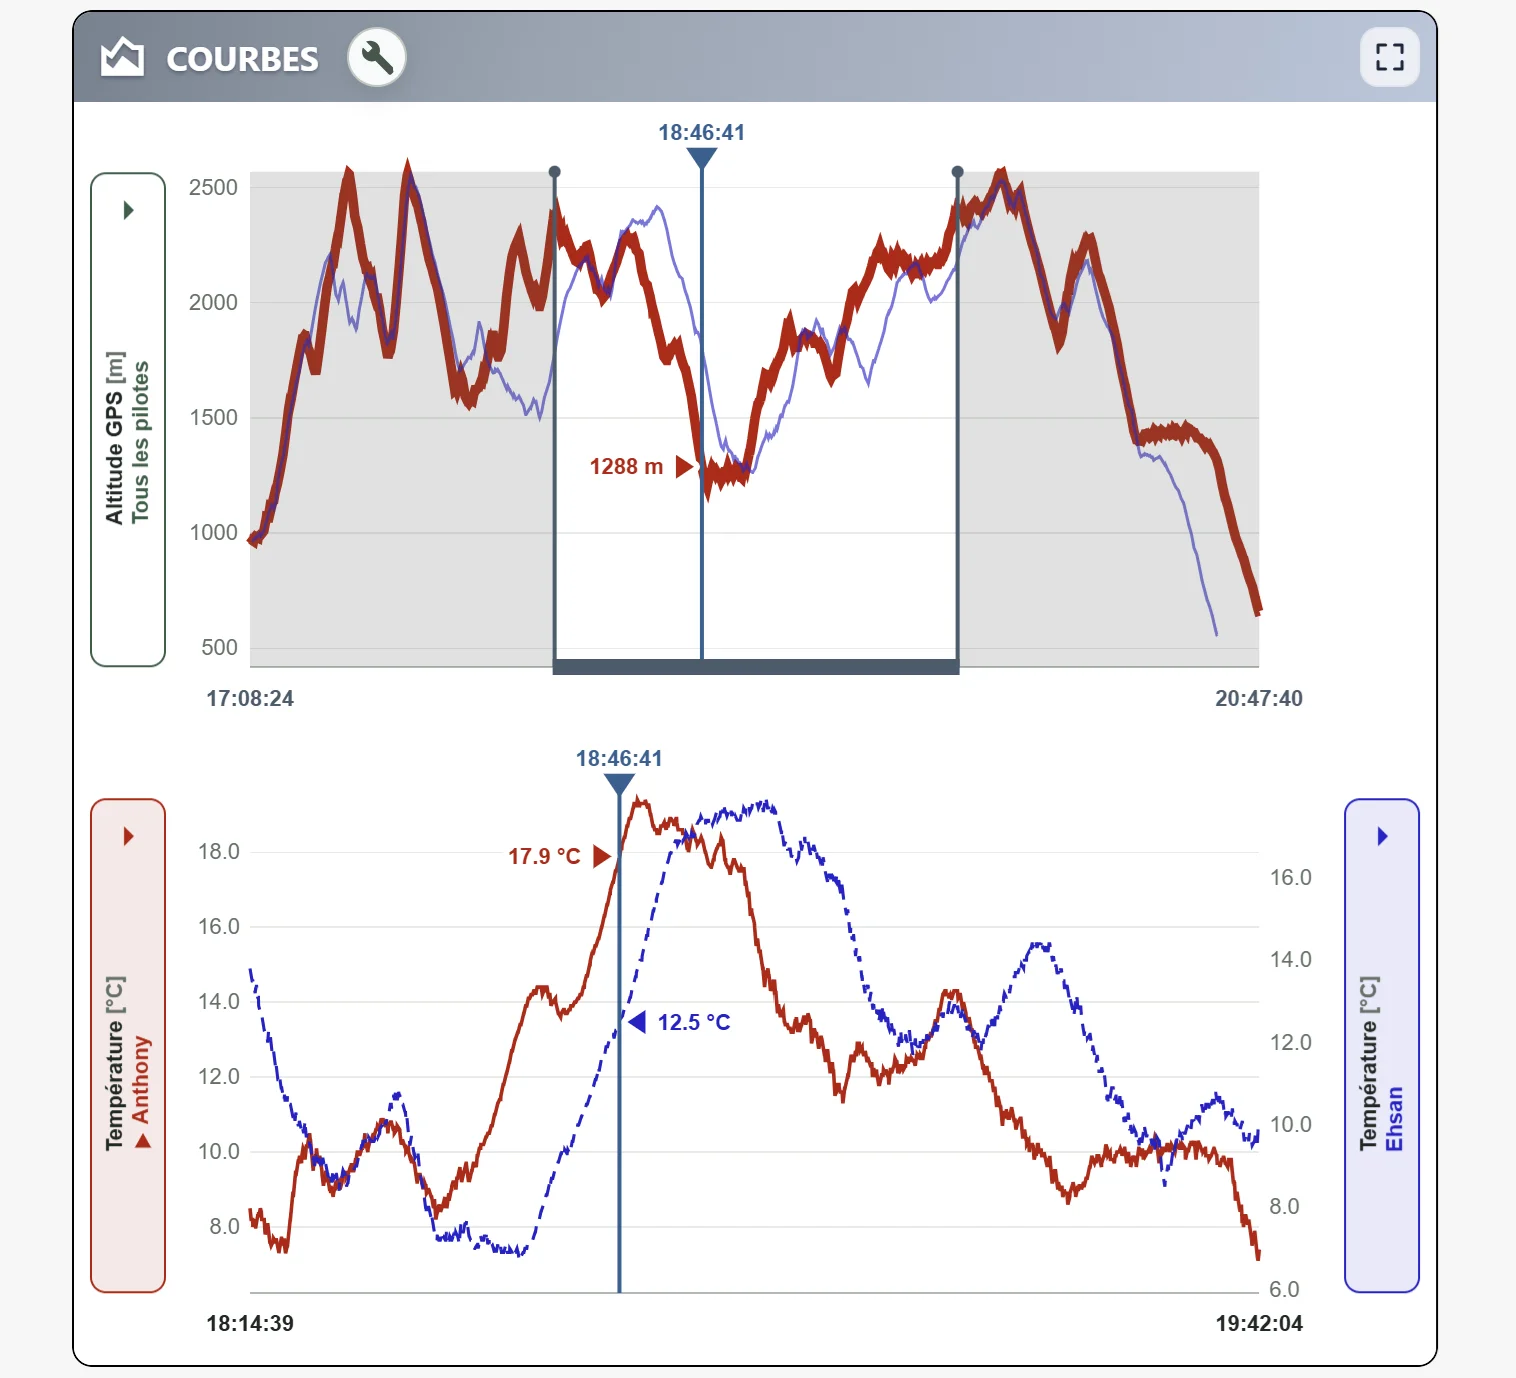
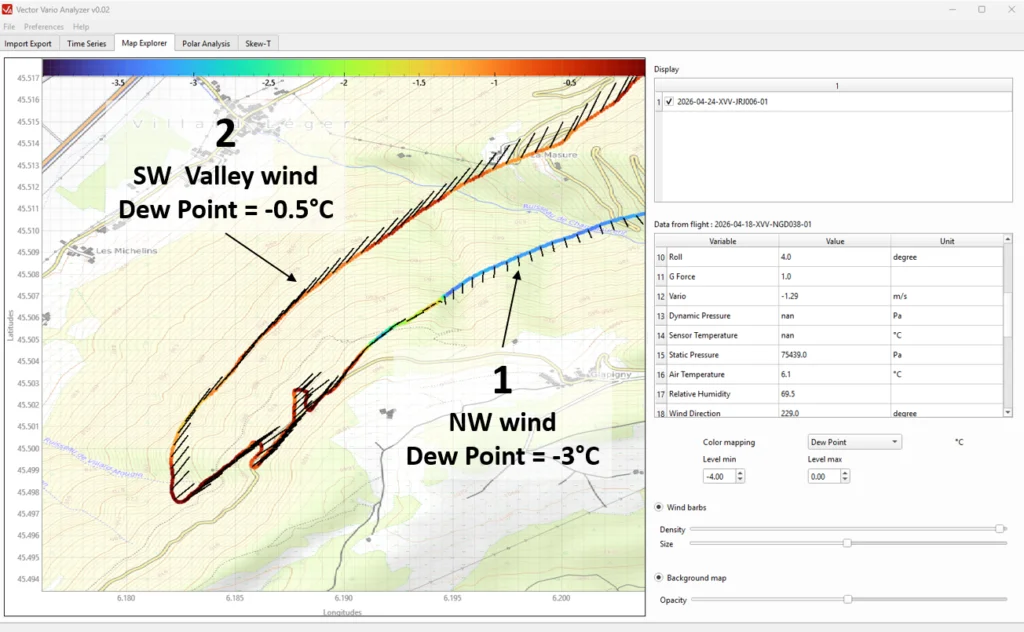
In particular, this tool makes it possible to visualise the wind in 2D and highlight correlations with other flight parameters.
The example below shows the analysis of a flight using the Vector Vario Analyzer, where the pilot leaves a northwesterly wind flow (1) and enters a southwesterly breeze layer (2) near the ground. The colour of the flight track represents the dew point temperature, which characterises the humidity of the air mass independently of altitude. We can observe that the dew point temperature increases when entering the valley breeze, indicating a change in the air mass.
Google Earth
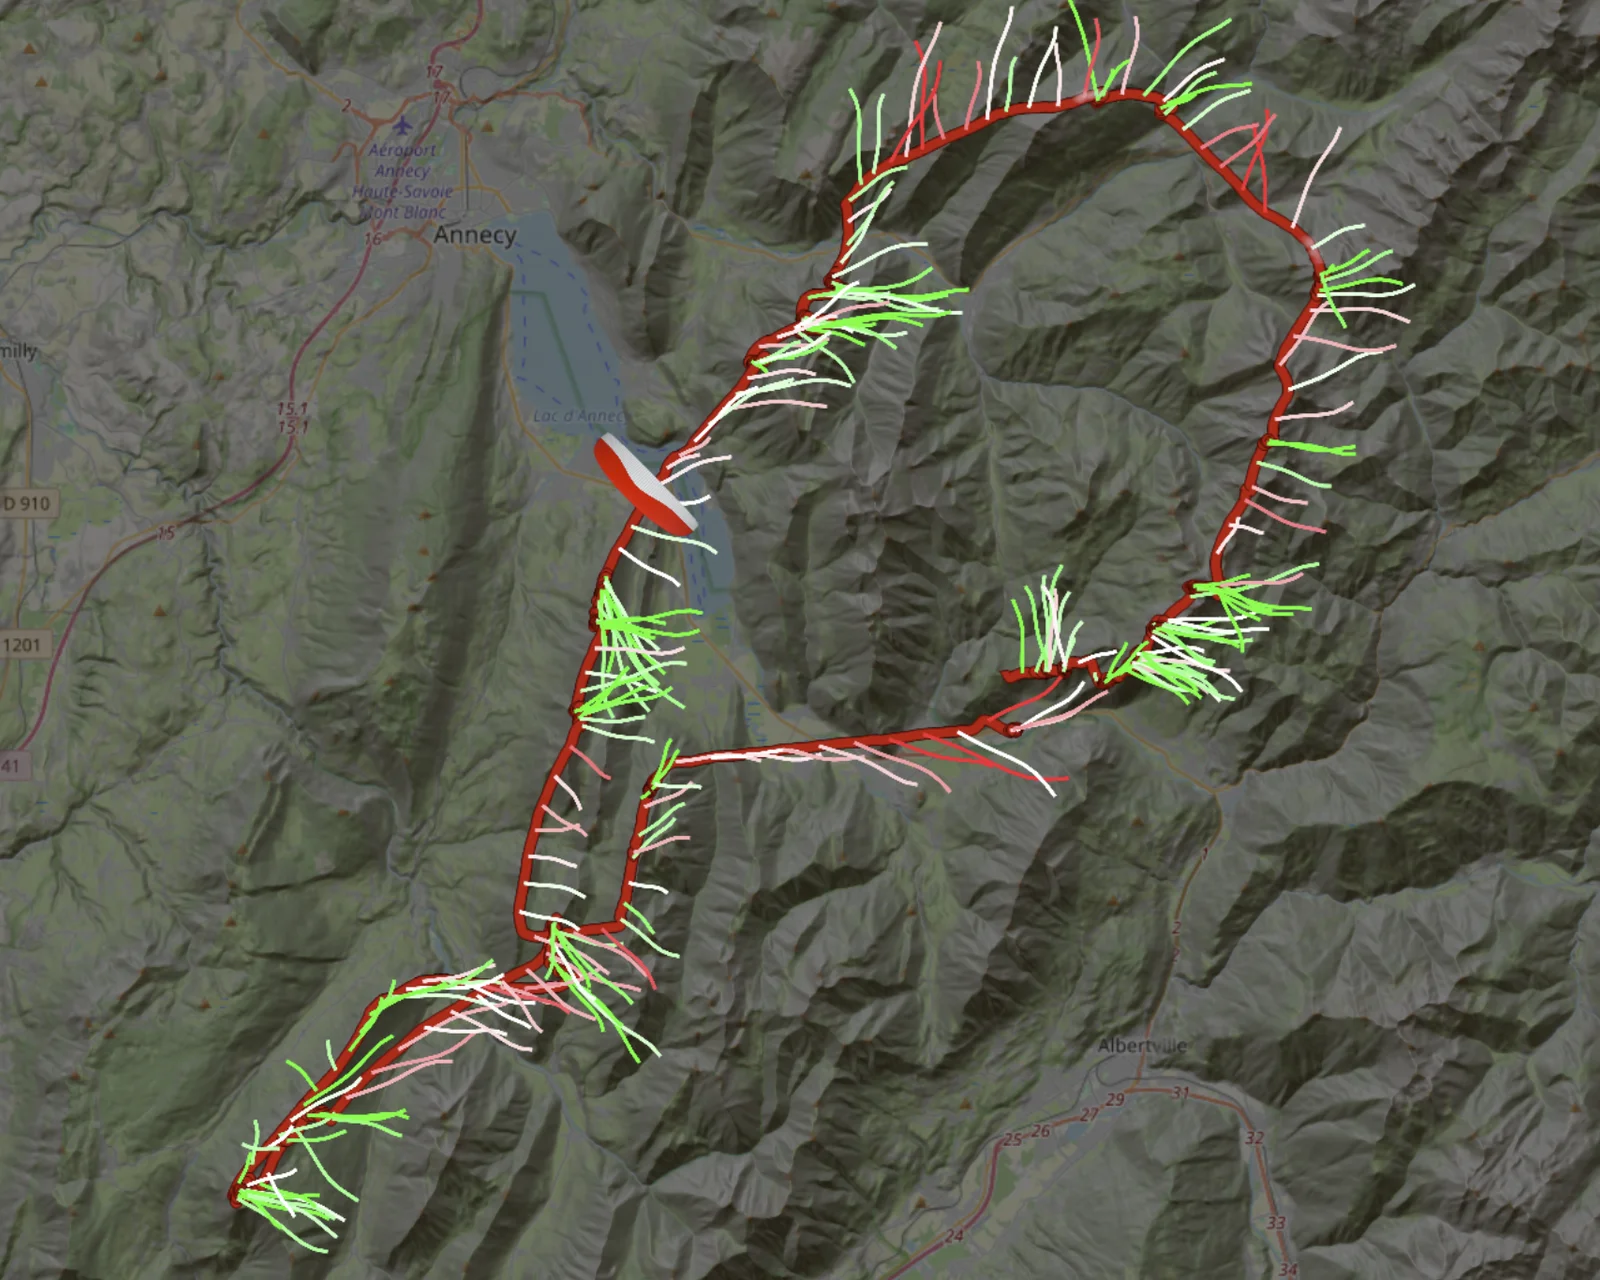
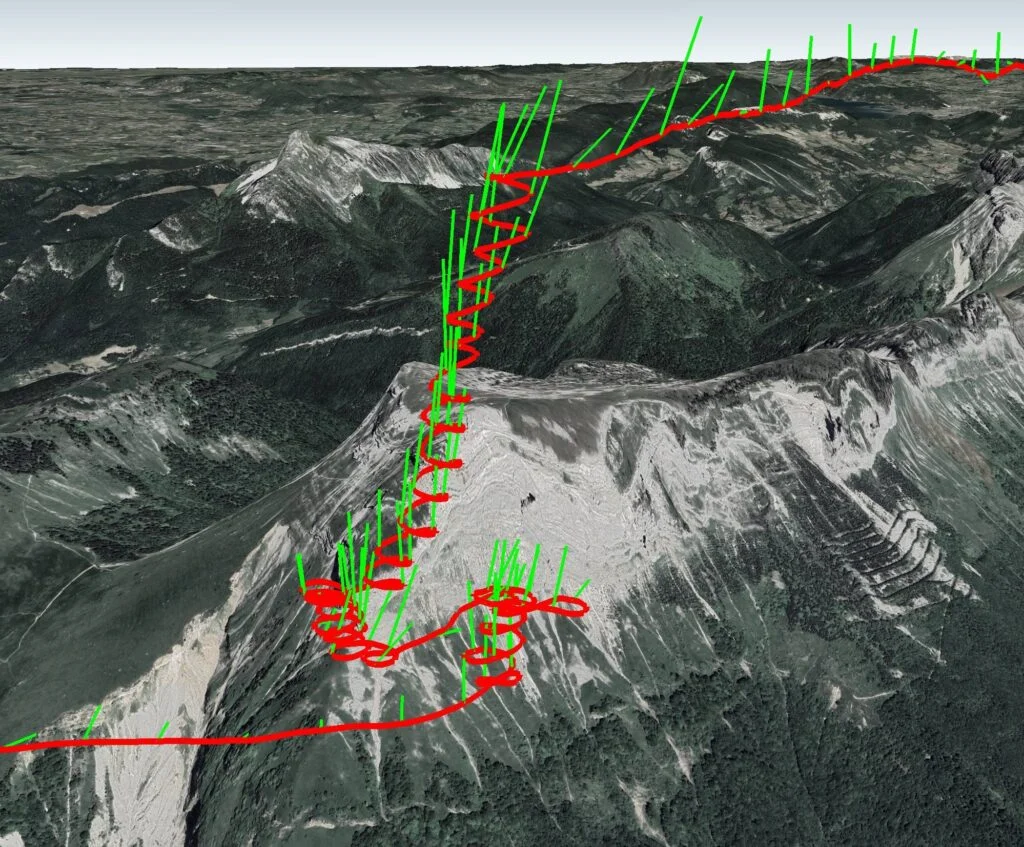
This is the ideal tool for visualising the wind in 3 dimensions throughout the entire flight. The wind is displayed using green lines that behave like miniature windsocks attached to the GPS track shown in red. These lines are carried by the wind flow and therefore indicate the wind direction of movement, not the origin of the wind.
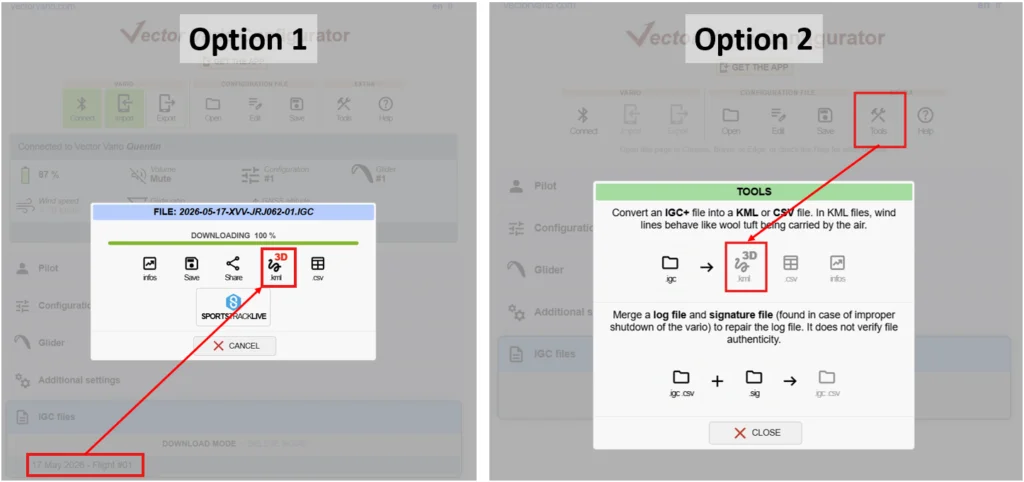
The KML file required to display this data in Google Earth can be generated from:
- the Vector Vario Configurator;
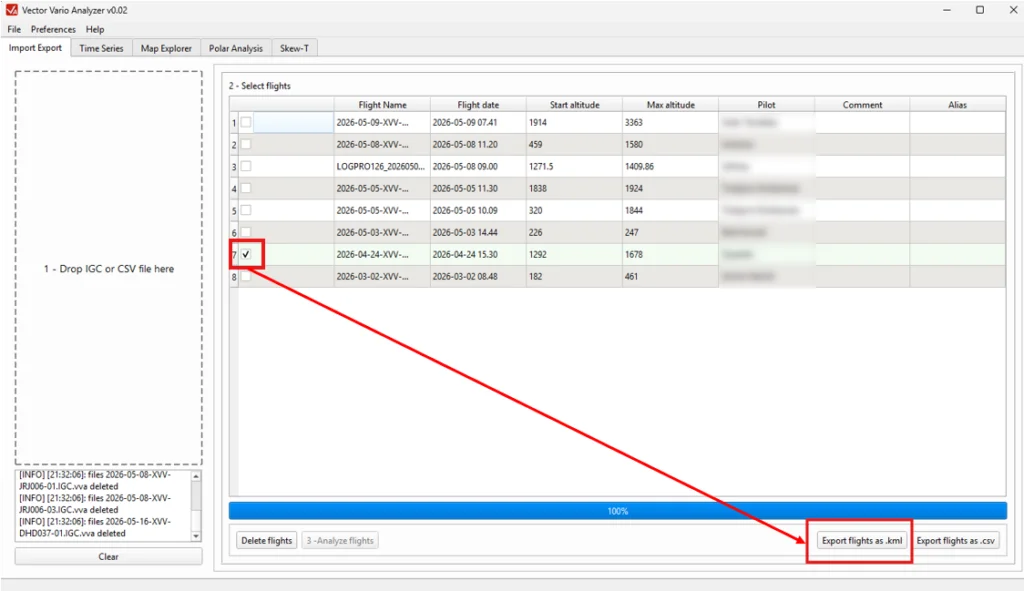
- the Vector Vario Analyzer.
In the Vector Vario Configurator, this can be done:
- directly after downloading a flight (Option 1) via Bluetooth (BLE);
- from the tools available in the main toolbar (Option 2), to convert an IGC file stored locally on your phone, tablet, or computer.
From the Vector Vario Analyzer, once the flight has been loaded, simply click the “export flights as .kml” button.
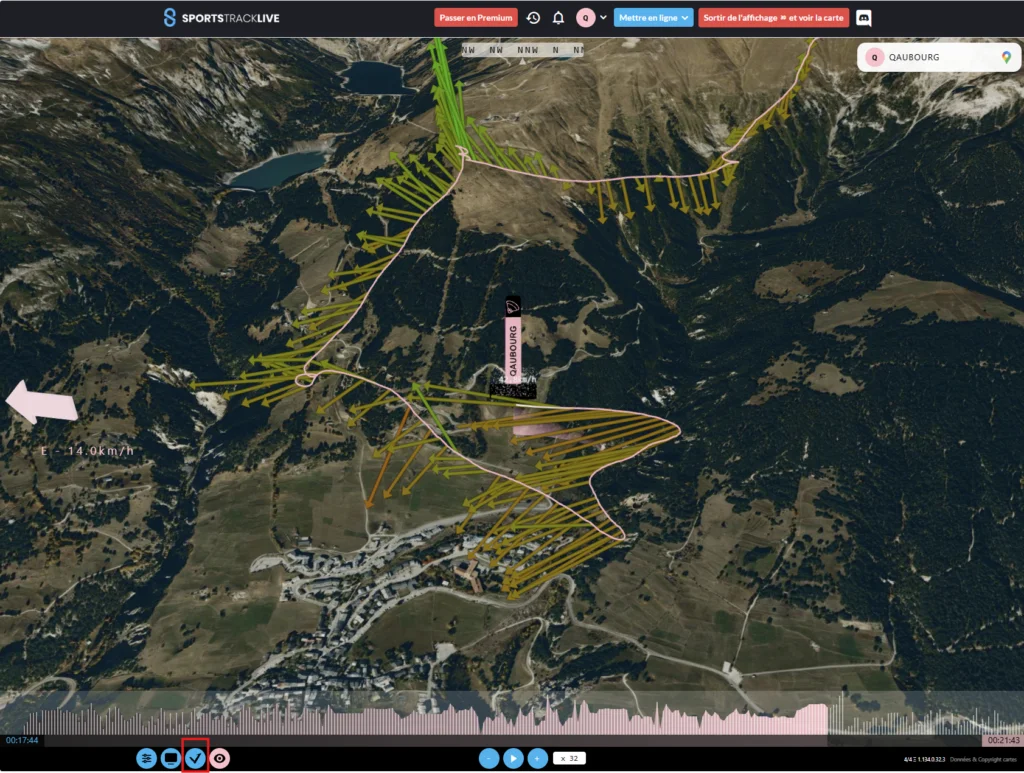
SportsTrackLive
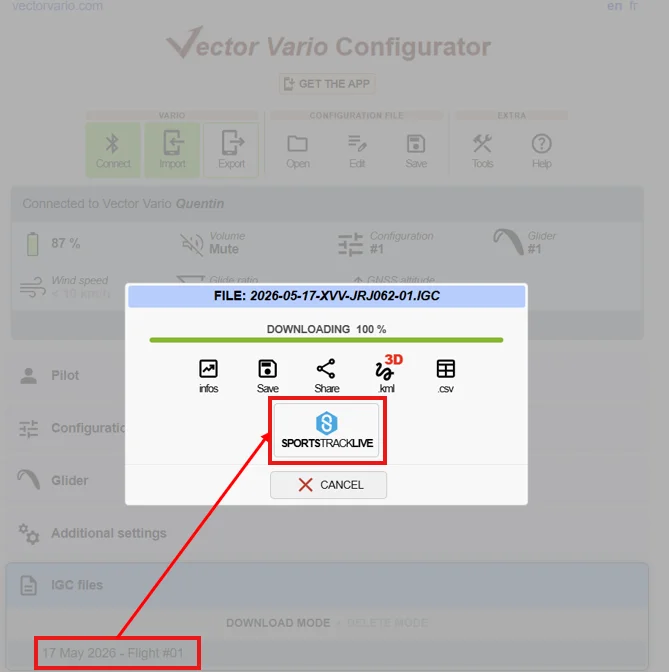
It is possible to upload an IGC+ flight track from the Vector Vario to SportsTrackLive. This can be done directly from the SportsTrackLive website or application, or via the Vector Vario Configurator with a single click after downloading the track via Bluetooth (BLE).
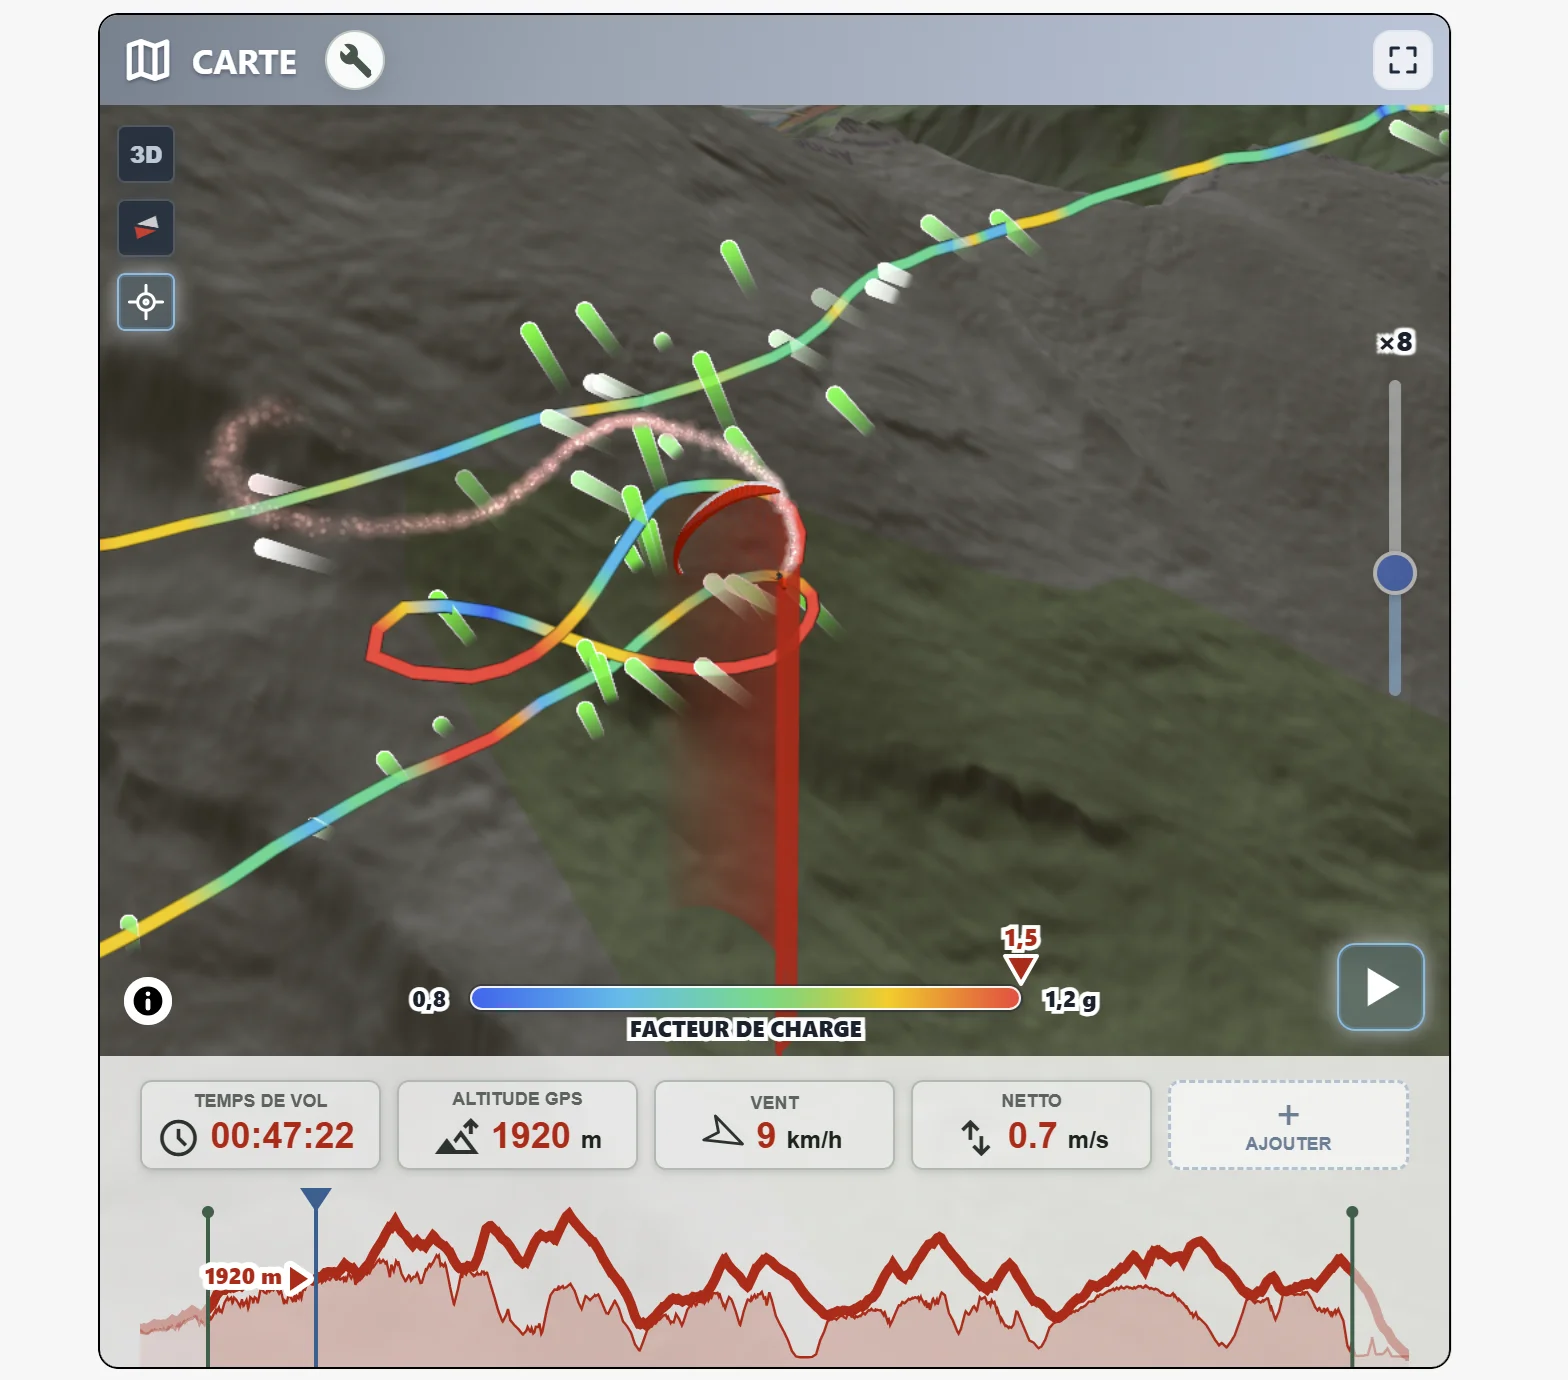
On SportsTrackLive, the immersive 3D flight replay is now enhanced with configurable wind vector visualisation, accessible through the Vector Vario icon in the bottom toolbar. This makes it possible to replay the flight as if you were there, while visualising the influence of the surrounding air mass in real time.